Why Your Soiling Sensor and Your SCADA Tell Different Stories — and Which One to Believe
If you manage a utility-scale solar plant, you have likely noticed the following at some point: your soiling loss sensor reports one figure, and your SCADA-derived performance ratio implies something different. The gap is usually small — tenths of a percent — but it is persistent, it does not resolve itself, and it creates uncertainty in both instruments.
This is not a calibration error that a maintenance visit will fix. It is a structural feature of how these two measurement systems work, and understanding why they diverge is practically useful for anyone responsible for plant performance.
They Are Measuring Different Things
This is the core of the issue, and it is not always clearly documented.
A soiling loss sensor — whether an optical forward-scattering device or a reference cell pair — measures the optical transmittance reduction on a small reference surface at a specific location on your site. It compares a soiling-exposed surface to a clean reference, calculates the ratio, and reports a soiling index. What it measures directly is how much less light passes through the particulate layer on that particular surface, at that location, at that moment.
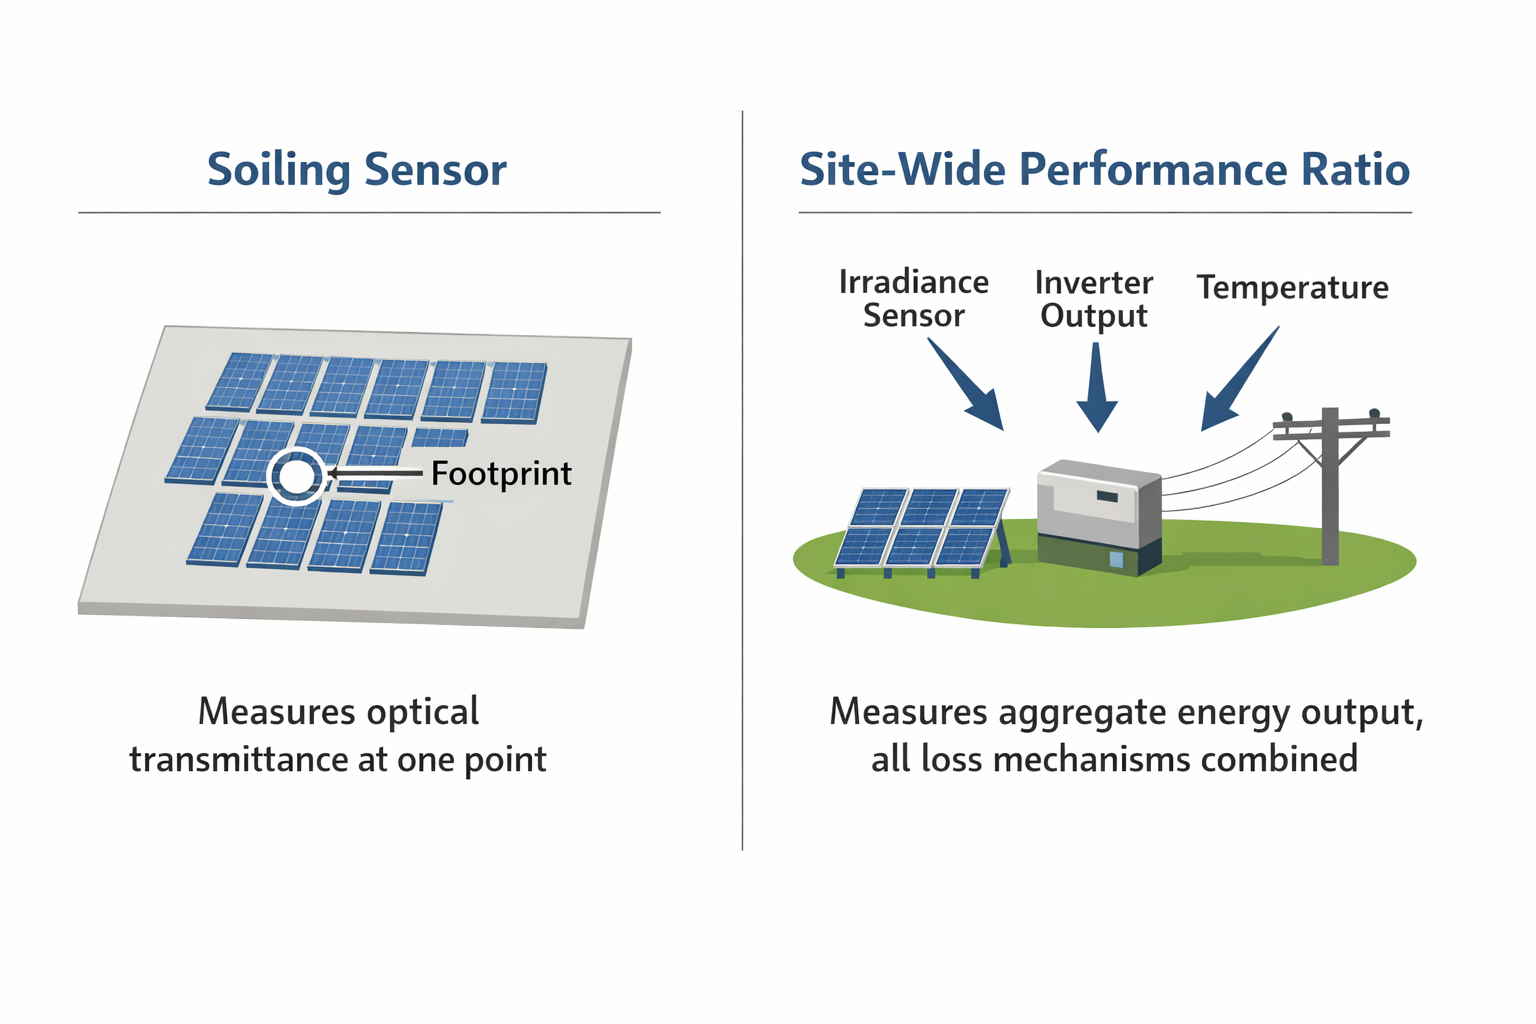
Your SCADA performance ratio works differently. It measures actual energy output relative to expected energy output across the entire plant, accounting for irradiance, temperature, and inverter availability. Soiling reduces output — but so do several other factors that performance ratio cannot separate from soiling without additional analysis: LID and PID degradation, module mismatch, inverter clipping, cable losses, and measurement uncertainty in your irradiance reference.
When these two figures diverge, it is rarely because one instrument is broken. It is because they were not measuring the same thing to begin with.
Five Reasons the Numbers Do Not Match
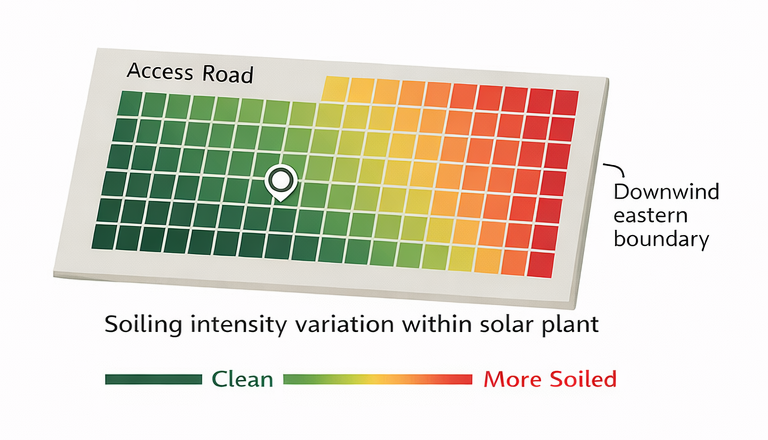
1. Your sensor is in one place. Your soiling is not.
At a 100 MW plant, a standard installation might include one to three soiling loss sensors. Those sensors measure soiling at their specific locations — typically near the meteorological station, often in a central area of the site. Soiling at utility scale, however, is rarely uniform.
"One point cannot represent 200 hectares of spatially variable soiling."
Published studies of large-scale plants have documented within-site soiling variation of three to six times between the most and least affected zones, driven by prevailing wind direction, proximity to access roads, adjacent land use, and terrain. A sensor positioned in a clean central area will consistently under-report the plant-average soiling loss relative to your performance ratio, because it does not capture the heavily soiled rows along the downwind perimeter or adjacent to unpaved roads.
This is a sampling problem, not a sensor defect. One measurement point cannot represent 200 hectares of spatially variable soiling.
2. Reference surface calibration degrades faster than most maintenance schedules allow for.
Reference cell-based soiling sensors require periodic cleaning of the reference surface and regular calibration against a known clean state. Most O&M maintenance schedules address soiling sensors quarterly or semi-annually.
Research published in Progress in Photovoltaics and Solar Energy has shown that uncleaned reference surfaces can accumulate sufficient contamination within four to eight weeks to introduce a systematic negative bias — the "clean" reference is no longer clean, making the exposed surface appear cleaner by comparison than it actually is. The result is a soiling sensor that consistently under-reads, while performance ratio continues to reflect the true production impact.
3. Optical forward-scattering sensors have documented angular response characteristics at low solar elevation angles.
Optical soiling sensors that operate on a forward-scattering measurement principle are sensitive to the angle between their measurement plane and the sun. At low solar elevation angles — morning, evening, and winter months at higher latitudes — published validation studies have recorded anomalous readings that do not correspond to physically measured soiling levels. Sensor manufacturers typically acknowledge this in their technical documentation and recommend filtering readings below approximately 20° solar elevation.
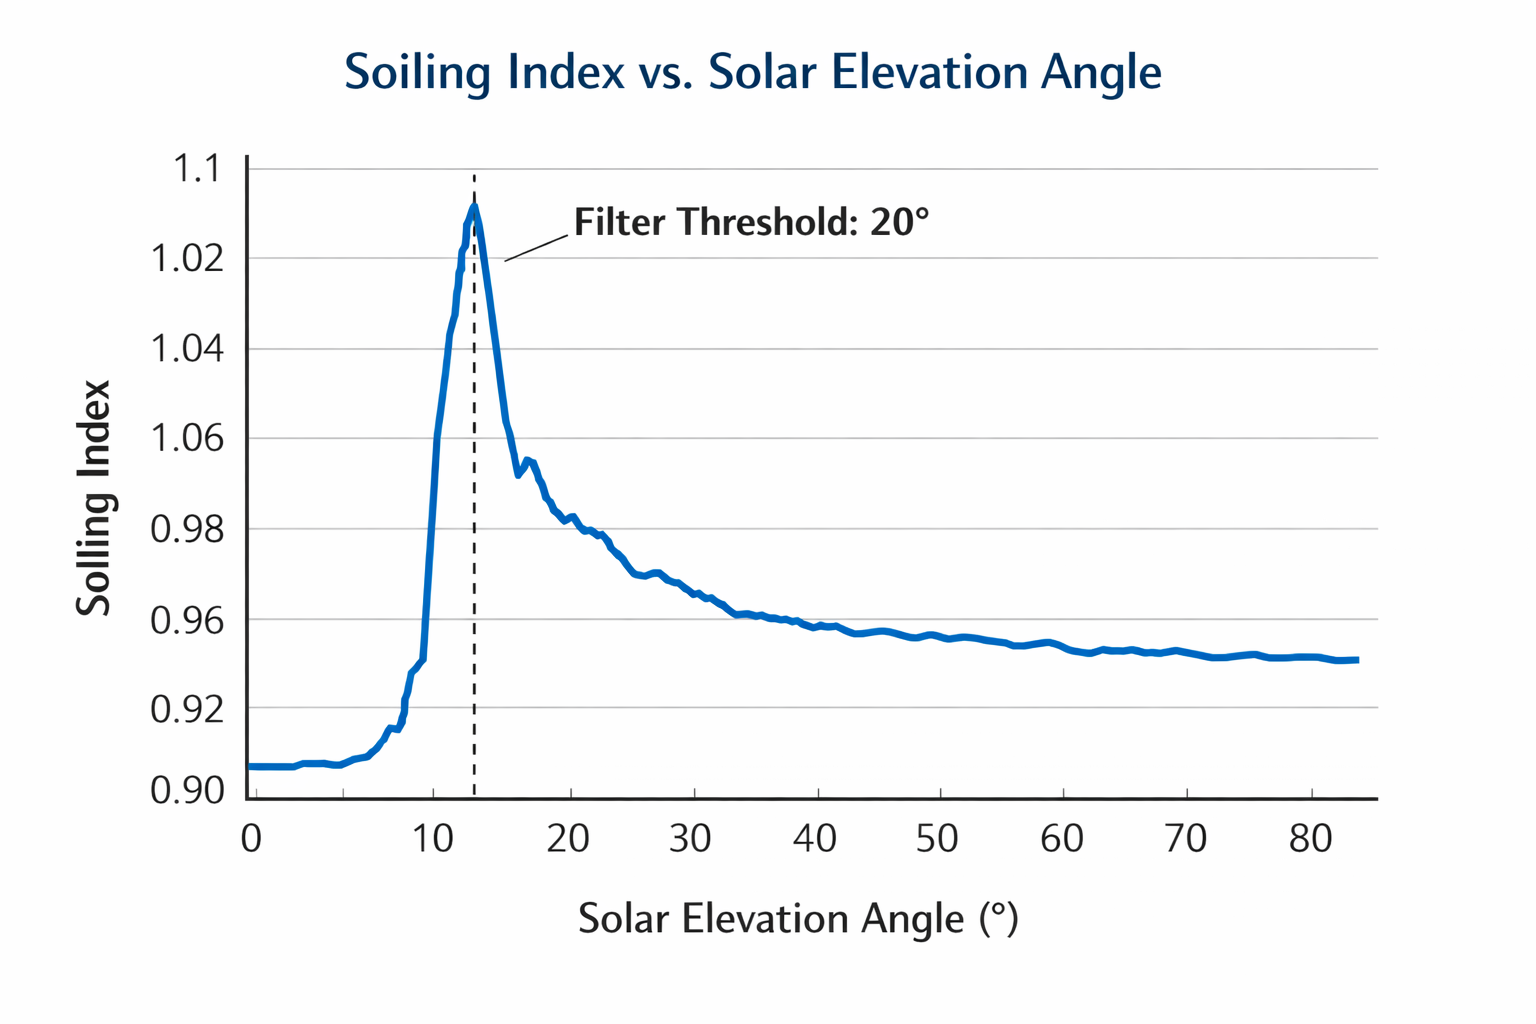
If your data pipeline does not apply this filter, your daily and seasonal average soiling figures include a systematic noise component that affects trend analysis.
4. Humidity and dew produce transient optical effects that sensors register as soiling.
Overnight condensation on panel and sensor surfaces changes their optical properties in ways that are not distinguishable from particulate soiling in early morning measurement windows. This effect is most pronounced at coastal sites, valley locations with strong radiative cooling, and irrigated agricultural areas. Plants in these environments can show apparent soiling spikes in early morning data that recover by mid-morning as dew evaporates — a pattern that has no relation to dust or particulate accumulation.
Performance ratio does not capture this effect, because morning irradiance is low and its contribution to the daily energy total is small. Soiling sensors logging at one-minute or five-minute intervals record the full dew signature.
5. Your performance ratio contains degradation losses that may be attributed to soiling.
This mechanism works in the opposite direction: performance ratio typically runs lower than soiling sensors suggest, and the gap often reflects degradation that has nothing to do with soiling. A plant in its fifth year of operation has accumulated LID stabilisation losses, some degree of PID where string voltage management is imperfect, and standard module degradation of 0.5–0.7% per year per IEC 61215 typical rates. These losses are permanent, gradual, and appear in performance ratio as a baseline offset.
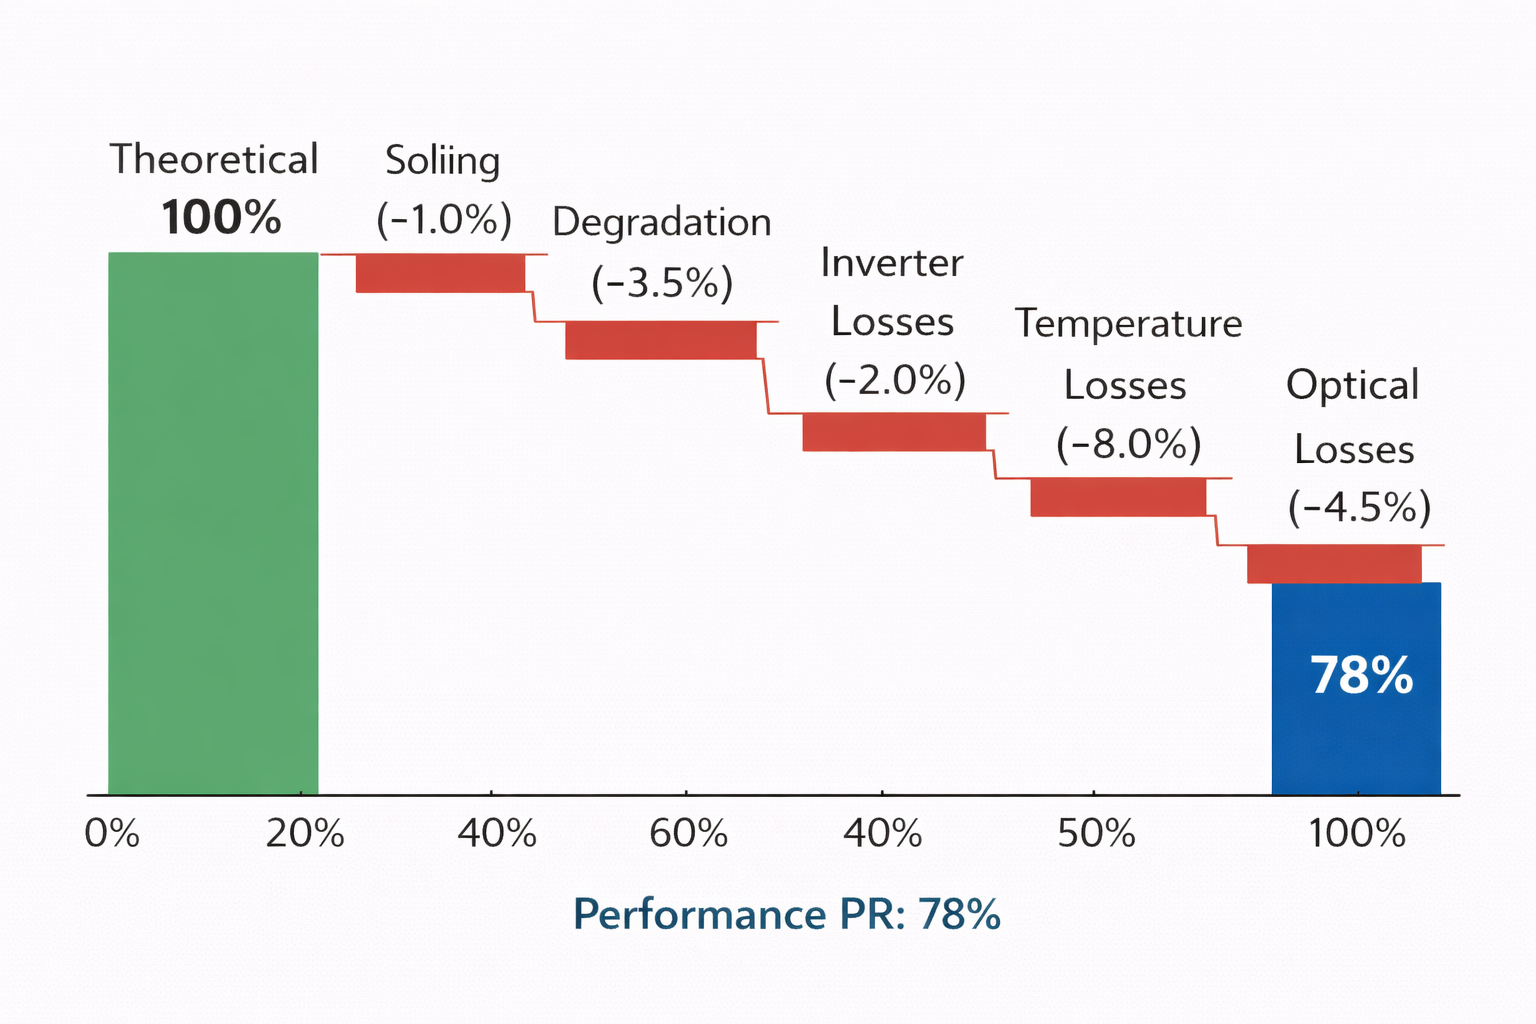
If your soiling sensor reports 0.8% soiling loss and your PR-derived estimate implies 1.4%, the 0.6% difference may not be measurement error — it may be three to four years of accumulated degradation that has not been separated from the performance ratio calculation.
Which Number Should You Trust?
Neither unconditionally — and that is a useful conclusion.
The soiling sensor provides the best available estimate of soiling at its specific location, provided it is well-maintained, correctly filtered, and interpreted with an understanding of where it sits on the site. It is a reliable trend instrument for detecting increases and decreases in soiling, confirming whether a cleaning event restored the baseline, and establishing the approximate order of magnitude. Used in that way, it is valuable.
The SCADA performance ratio provides the aggregate economic reality of your plant's output — all loss mechanisms combined, not individually attributable. It tells you whether the plant is underperforming, but not the cause.
Accurate diagnosis requires both, along with two additional data points that most plants do not routinely collect: a spatial picture of soiling variability across the site, and a quantified estimate of degradation losses separated from soiling. Without those, two instruments are producing contradictory figures with no reliable basis for choosing between them.
What Sound Measurement Practice Looks Like
IEC 61724-1 defines three tiers of measurement quality — basic, intermediate, and advanced — and is clear that single-point soiling sensing does not meet the spatial coverage requirements for accurate plant-level soiling loss attribution at large sites. The standard is not always reflected in O&M contracts, but it is the reference against which measurement data quality is increasingly assessed by lenders and asset acquirers during due diligence.
In practice, a credible soiling measurement setup for a plant above 50 MW requires: multiple sensor locations distributed to capture the site's dominant wind and terrain gradient; documented calibration records at intervals no greater than eight weeks; data filtering applied for solar elevation below 20° and relative humidity above 85%; and an independent cross-validation method — IV curve tracing, string-level SCADA analysis, or spatial imaging — applied at least quarterly to verify that the sensor array is representative of whole-site conditions.
Most plants operating today do not meet this standard. The question is whether existing soiling data is accurate enough to support the cleaning and reporting decisions that depend on it.
The Case for Independent Validation
The gap between what a sensor network reports and what is happening across a full site is the central argument for independent cross-validation. Satellite-based soiling analysis — using multi-spectral imagery processed against a clean site baseline — does not replace sensors, but provides something a sensor network cannot: a spatially complete picture of soiling across the entire site, updated on a weekly cycle, derived from an independent measurement method.
When the sensor reports 0.8% and satellite analysis indicates 1.3%, there is a meaningful diagnostic question to investigate. When both figures align, there is a solid basis for the number that goes into an asset owner or lender report.
DataLux SkySense provides satellite-based soiling analysis for utility-scale solar plants. If you would like to see a sample soiling report for one of your sites — including spatial soiling maps and a comparison against your existing sensor data — contact us here.